Industrial Technology Research Institute, Dmitry Sherstoboev, Mark Yang, Ming Jiang
APM (Application Performance Management) is becoming more and more important in the digital economics as 100 msec latency may cause millions of dollars loss in sales in an e-commerce site like Amazon. To identity latency it is critical to determine Application Dependency Mapping (ADM). ADM determines relationships among inter-dependent applications. Specifically, ADM identifies: The devices that are communicating with one another. The TCP ports these devices use for communication. The processes that are running on these devices. For example, if a web server application uses a database server application, the web server depends on the database processes. The web and database server run on the host or server cluster devices. The data from running processes can be used to determine which devices to drill into to see more application-specific configuration information. Traditionally, agents or instrumentation are used to obtain ADM. However, agents or instrumentation are difficult to maintain in a highly distributed system. The paper presents an agentless APM based on accurate application dependency map by intercepting VM execution and introspecting VM state without agents or instrumentation in applications.
Introduction
Traditionally, IT infrastructure has been mostly driven by tribal knowledge, myriad spreadsheets and audits to keep track of dependencies. But due to the proliferation of so many devices, it has become increasingly difficult to track dependencies using these age-old techniques. The advance of more matured computation virtualization techniques in distributed virtual data center (VDC) due to cloud and multiple cloud computing and financial impact have triggered the need of more manageable ways for APM [1].
What is the need of a distributed application’s performance management system? A single node’s performance problem or failure in a distributed system would affect whole distributed system’s Quality of Service. Moreover, comparing with hardware failure or resource exhaustion, software problem is harder to detect. Hence the need of a dependency mapping system arises to improve the visibility of running applications and the ability to analyze the root cause of problems in real-time dynamic multi-tenant environment.
Related Works
1.Agent-based approach
When an agent is deployed in each computing host, various metrics (such as CPU, Memory, and Storage utilization or application queue depth) can be obtained for the host and applications running in the host. To determine Application Dependency Mapping (ADM), an obvious solution would be to install agent/daemon on every machine to run in background collecting inter-machine TCP traffic log and generate inter-machine level dependencies. The drawback here is that even with additional daemon software the results would be inaccurate since one TCP connection may connect to any one of server processes in one machine. Improvising the above technique to process level architecture would still not be good enough. That is, suppose if we make the daemon read kernel’s /proc information to get the process related to TCP connection and collect inter-process TCP traffic log and generate inter-process level dependencies. The drawback here is that this technique can only generate static inter-process dependency map and hence does not fulfill our requirements.
2.Agentless approach
Previous agentless approaches are based on SNMP, CLI, or public known API. Our approach for socket based application-level dependency map discovery is based on a virtual machine introspection by executing the following steps: A. Intercept guest OS’s at packet sending system call B. Perform VM introspection to get running thread and TCP connection information. Send this traffic log to server C. Convert thread based traffic log into inter-thread traffic log in APM (Application Performance Management) server D. Generate accurate application dependency map from inter-thread traffic logs Our approach looks into the thread level execution of the connections. The VM introspection approach eliminates the need of installation or port polling. The interception at system call enables quick detection and deployment of changes. And lastly logging the traffic at inter-thread level ensures the generation of accurate application dependencies. Furthermore, the usability of our prototype extends to both multi-process or multi-thread server and the prototype also produces the trajectory along with an accurate application dependency map. Detail comparisons and APM categories can be found in [2]. Some related open source APM systems are Dapper[3] and Pinpoint [4].
System architecture
The system consists of a packet logger, an introspector, and an analytic engine as depicted in Fig-1.
Packet logger
Using combination of ebtables rules and modified ebt_nflog kernel module we can collect information about every packet to and from the VM.
Introspector
For each packet gathered by packet logger we are using VM introspector to gather additional information. We use sequence number, source and destination IP/port values to assign thread information to the right packet.
Analytic engine
Analytic engine is used to evaluate results gathered by packet logger and introspector and create a so called “trajectory” which represents distributed application structure. Analytic engine consists of two parts: client and server. Client is installed on every physical machine in observable network and gathers information from packet logger and introspector.
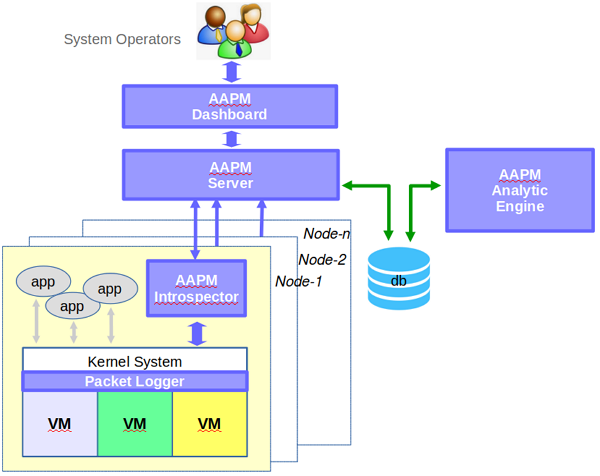 Figure 1 AAPM Architecture
Implementation
Many APM systems have been proposed for distributed and web transaction systems [5, 6, 7]. The implementation includes of a front dashboard and a backend data collector. We will now discuss each step in detail for Socket-based applications:
Step #1: Intercept guest OS at packet sending system call
For now we discuss a socket based message architecture application in a Linux environment. Any such application calls functions like socket() and close() to operate on the messages. The basic idea of intercepting all functions seems to be impractical as exiting from one VM to another would take time and thus result in a low hit ratio slowing down the performance. Hence we come up with a different alternative of just intercepting two functions tcp_sendmsg() and close() by looking deeper into the VMM architecture. The work is summarized in Fig-2.
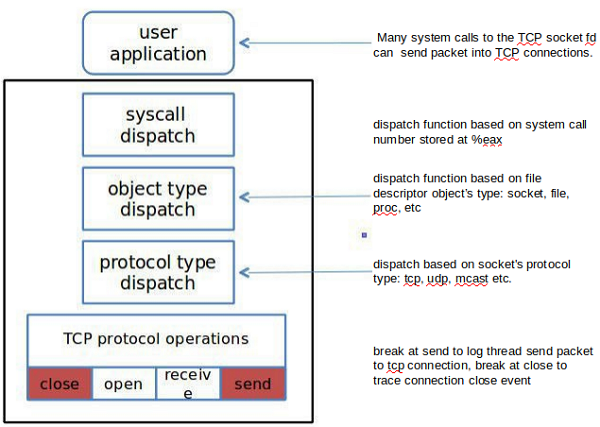 Figure 2 Packet Interception
 Step #2: VM introspection for process and TCP connection
The TCP information can be directly generated from the parameters of tcp_sendmsg().
Step #3: Convert thread based traffic log to inter-thread traffic log
The VMM create thread based traffic logs and send them to DOM0 fwd daemon which in turn forwards the log entry to APM server. The APM server finds the destination process of each traffic log and store it in the required table.
Step #4: Generate accurate application dependencies from inter-thread traffic log
This subroutines depends on the log entry to find out the other dependencies.
Step #5: Incremental enabling traffic logging
With the above given explanation, we can see that the cost for collecting a dependency include: a) intercepting system call by VMM, b) transferring log entry to APM server, c) storing log entry into APM database. With large network size and large number of computing nodes in a single VDC the efficiency with the above technique was questionable. Hence to increase efficiency we adopted a three phase approach: a.) Learning phase (identify VM): enabling incremental VM traffic logging, b.) Discovery phase: collect thread-based traffic log, c.) Generation phase: identify application dependency. The implementation includes of a front dashboard of Fig-3 and a backend data collector.
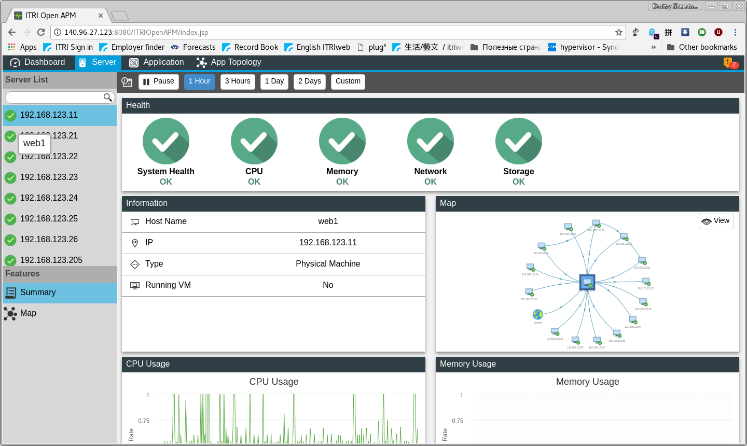 Figure 3 APM Dashboard
We will now discuss in detail for Message-based applications:
One message-based application is OpenStack. It adopts RabbitMQ as core messaging infrastructure and an example of message-queue based application as in Fig-4,5.
There are several components of OpenStack inter-communicate through message passing as follows: Compute (Nova), Object Store (Swift), Image Service (Glance), Neutron Service, Keystone and Dashboard Horizon.
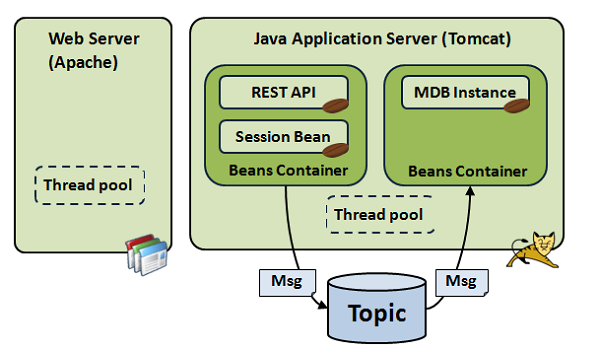 Figure 4, 5 Message-Queue Application Example
Below Fig-6 shows us the relationships between the services. This integration is facilitated through public application programming interfaces (APIs) that each component/service offers. These APIs allow each other the services to use another services, as well as to switch out any service (as long as they maintain the API).
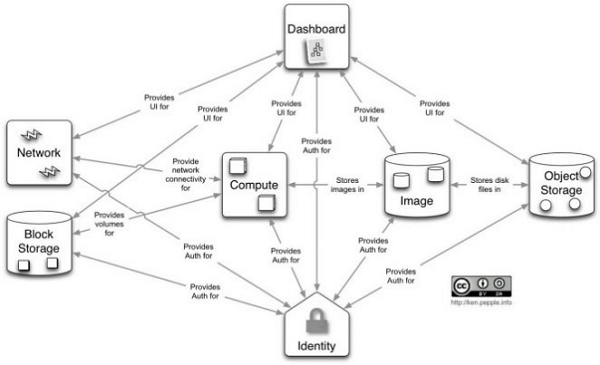 Figure 6 Conceptual Architecture of OpenStackNotice
The messages captured will be checked against OpenStack project Monasca[8]. One can listen in on events being passed around between daemons (via RabbitMQ) to get an idea of system state at a given point in time.
Experiment Results and Analysis
1.Performance and accuracy tests
We test the APM software in two aspects: performance and correctness. For APM’s performance, we start application running in VM, benchmark the application’s performance with APM software on/ off. Then, compare the benchmark results of the two tests and know the performance degradation brought by APM software. We choose the TPCW as our target application in APMs socket based application tests. The TPCW is the software that emulates clients and servers of an e-book store. The APM software’s CPU utilization of the two tests are both under 10%.
Table 1 CPU utilization of APM for TPWC application, Linux guest, 700 emulated browsers
| Item |
APM off |
APM on |
APM’s CPU utilization |
| Machine 1 CPU utilization (%) |
26.5% |
33.0% |
+6.5% |
| Machine 2 CPU utilization (%) |
19.8% |
23.6% |
+ 3.8% |
Table 2 CPU utilization of APM for TPWC application, Linux guest, 900 emulated browsers
| Item |
APM off |
APM on |
APM’s CPU utilization |
| Machine 1 CPU utilization (%) |
30.7% |
40.0% |
+9.3% |
| Machine 2 CPU utilization (%) |
24.6% |
34.4% |
+ 9.8% |
Table 3 Accuracy test results
| Item |
Test #1 Value |
Test #2 Value |
| Number of emulated browsers |
500 |
500 |
| Number of requests with test-id |
1122 |
1088 |
| Correct trajectories by ADT software |
1121 |
1084 |
| Accuracy ratio (%) |
99.91% |
99.6% |
2.Testing APM on top of OpenStack
Testing platform consists of 3 machines: OpenStack controller and 2 Compute nodes.
Table 4 Software version for OpenStack testing
| OS distribution |
Ubuntu 14.04.5 |
| OS kernel version |
4.4.0-53-generic |
| Apache version |
2.2.2-1ubuntu1.6 |
| Jboss version |
3.2.7 |
| TPCW server application |
tpcw-nyu-uva |
| TPCW client application |
tpcw-uva-client |
Testing results
In the APM UI we can see that two distributed applications do not overlap or distort. That proves that multi-tenancy is implemented correctly in the backend. As shown on Fig-7.
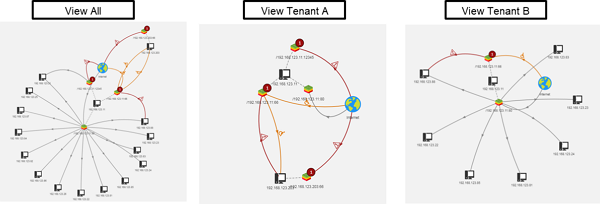 Figure 7 OpenStack testing result
Conclusion
This paper presents a novel agentless approach for Application System Management. From application execution log and VM introspections, ADM is derived. Also, latency is measured in each instance of trajectory. Root cause analysis is then applied to determine the link, node, or application failure or slowdown. Future works can extend APM framework by adding more intelligence for other applications or models of system performance [10, 11] as described by the author “Performance-aware systems are an important step towards automatic system management and an essential part of managing increasingly complex and distributed systems.”
Acknowledgment
The authors wish to thank Mukai Huang and Arc Huang for their help on reviewing manuscripts. This work was supported in part by a grant from DOIT, MOEA.
Reference
[1]Kit Eaton “How one second could cost Amazon $1.6 Billion in Sales,” https://www.fastcompany.com/1825005/how-one-second-could-cost-amazon-16-billion-sales Mar 2012
[2]https://www.eginnovations.com/product/agentless-monitoring
[3]Benjamin H. Sigelman, Luiz Andre Barroso, Mike Burrows, Pat Stephenson, ´ Manoj Plakal, Donald Beaver, Saul Jaspan, Chandan Shanbhag, “Dapper, a Large-Scale Distributed Systems Tracing Infra-structure,” Google Technical Report dapper-2010-1, April 2010
[4]Woonduk Kang, “Technical Overview of Pinpoint” https://github.com/naver/pinpoint/wiki/Technical-Overview-Of-Pinpoint
[5]Rodrigo Fonseca George Porter Randy H. Katz Scott Shenker Ion Stoica, “X-Trace: A Pervasive Network Tracing Framework.” 4th USENIX Symposium on Networked Systems Design & Implementation (NSDI’07), April 2007
[6]Ben Sigelman, “Towards Turnkey Distributed Tracing” https://medium.com/opentracing/towards-turnkey-distributed-tracing-5f4297d1736
[7]T. Gschwind, K. Eshghi, P.K. Garg, K. Wurster, “WebMon: A performance profiler for web transac-tions” http://ieeexplore.ieee.org/document/1021256/?reload=true
[8]OpenStack Monasca project https://wiki.openstack.org/wiki/Monasca
[9]OpenStack oslo/messaging https://wiki.openstack.org/wiki/Oslo/Messaging
[10]Paul Barham, Rebecca Isaacs, Richard Mortier, and Dushyanth Narayanan, “Magpie: online modelling and performance-aware systems,” http://static.usenix.org/legacy/events/hotos03/tech/full_papers/barham/barham_html/paper.html
[11]Edward L. Haletky, “Using Application Performance Management for Security,” https://try.newrelic.com/rs/newrelic/images/NewRelic-Using_APM_for_Security.pdf, Aug 2012
相關連結: 回181期_5G技術專輯
相關連結: 5G-Crosshaul網路技術